I will explain what I used to make my project.
Neocities: Neocities is a free web hosting service and it's very easy to use. With Neocities I have been able to hang my project and make the image map that I will show below.
ImageJ: ImageJ is a public domain digital image processing program. This is the program that I have used to measure the area of each energy spectrum. It is very easy and fast to use, because the only thing I have had to do is open the image from the program. Then with a tool that I have indicated In the next photo I have traced the area of each peak. Finally I give it to analyze and measure. And this is how I have calculated all the areas.
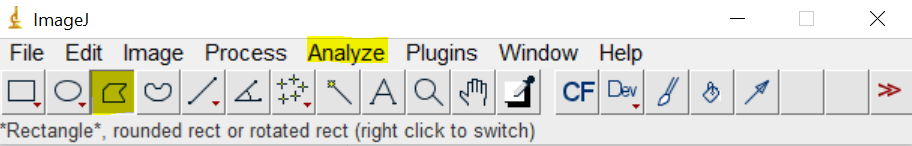
Image map: An image map is a list of coordinates related to a specific Image, created to hyperlink areas of the image to different destinations. I have made an image map with my constellation Orion. From this image I have added circles of different colors on top of a star. If you hover the mouse over the circle, it is connected to an external web page that talks about that star or about that celestial object.
You can click here and see my image map: https://lauraapolzan.neocities.org/mapa/index.html
Chandra: In order to find the graph with the energy spectrum, I had to search this database. I have entered the name of the object I was looking for and I have given search. If the object is in this database, the following will appear:
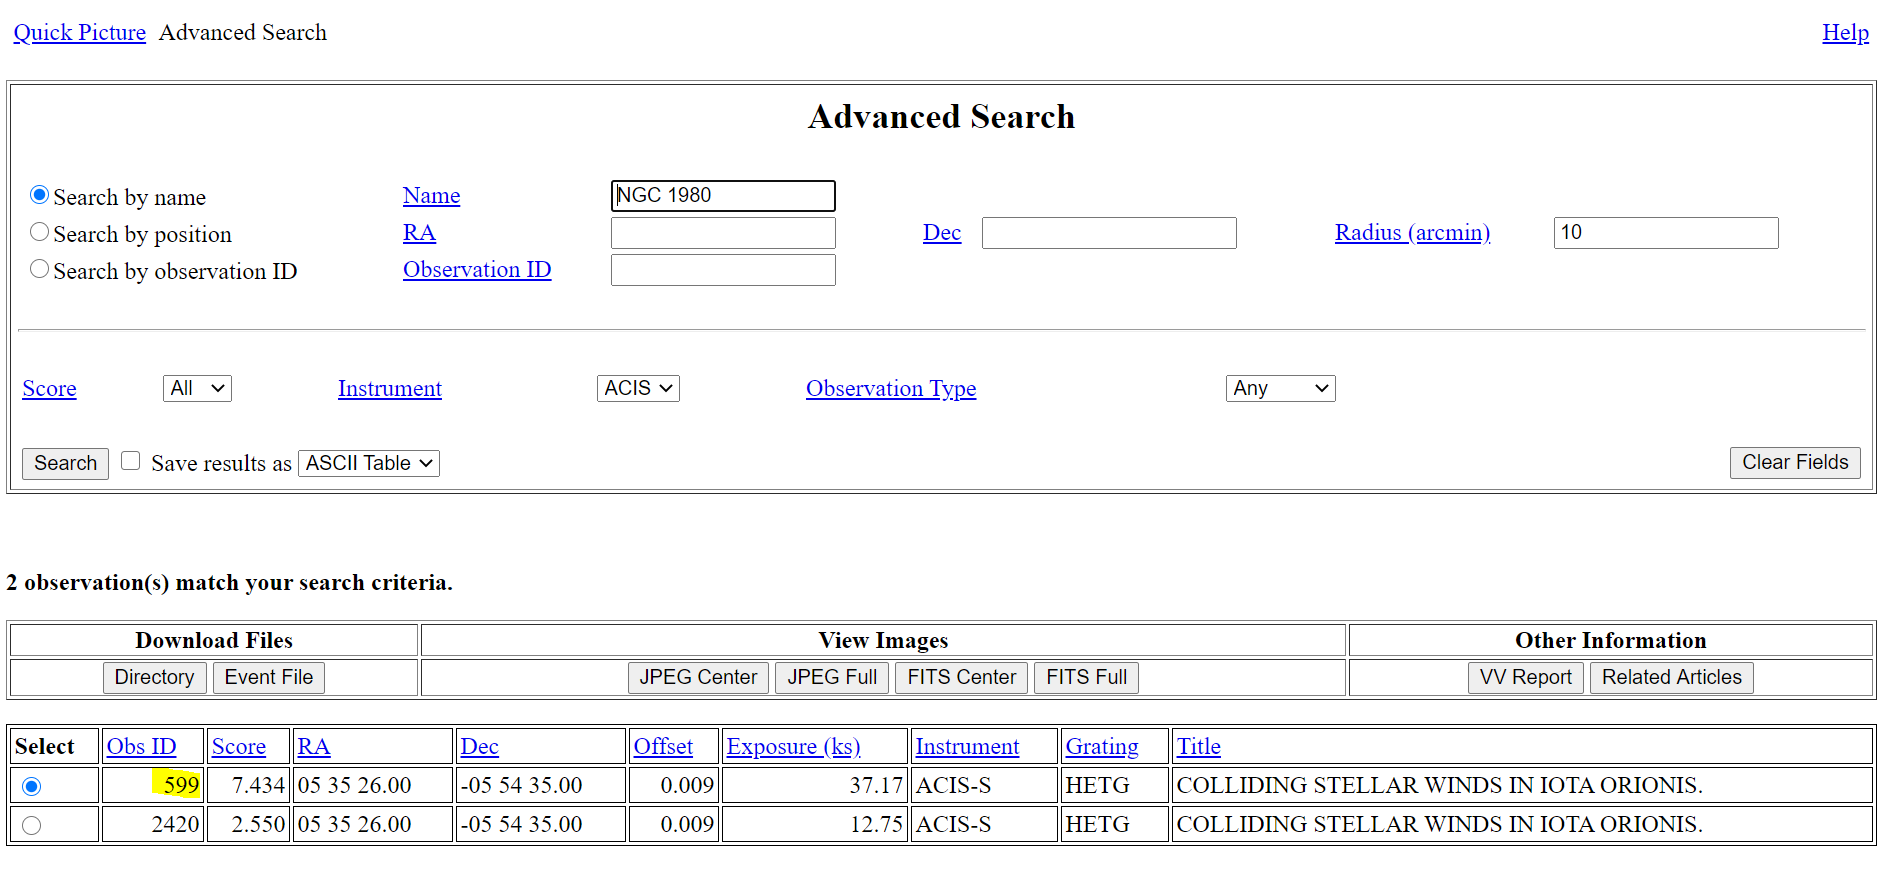
We copy the number that appears and enter it in observation ID of this web: https://cda.harvard.edu/chaser/ . Finally we will select the one we want and a document will be sent to our email.
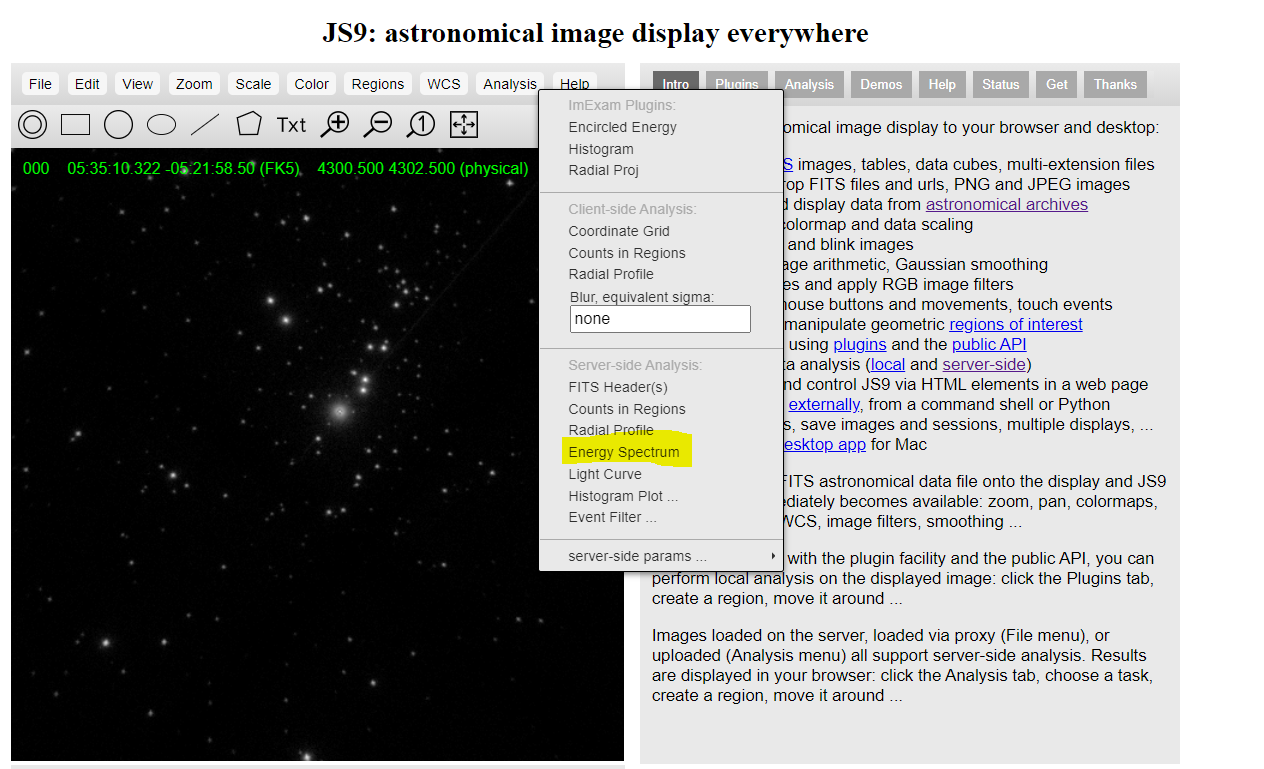
JS9: brings astronomical image display to your browser and desktop.
After we have downloaded the document, we will enter it on this website and the graph will appear with the energy spectrum.
EzyZip: it is what I use to extract tar online.
R AND EXCEL:
-Microsoft Excel is a spreadsheet developed by Microsoft for Windows, macOS, Android, and iOS. It has calculus, graphical tools, calculator tables, and a macro programming language called Visual Basic for Applications. With Excel I have been able to make a graph of Cepheids and a fomula, which you can see in the CEFEIDAS section. It is a very simple and easy to use program.
I have also calculated a formula using R. R is designed to handle larger data sets, to be reproducible, and to create more detailed visualizations. Instead, Excel starts off easier to learn and is frequently cited as the go-to program for reporting, thanks to its speed and efficiency.
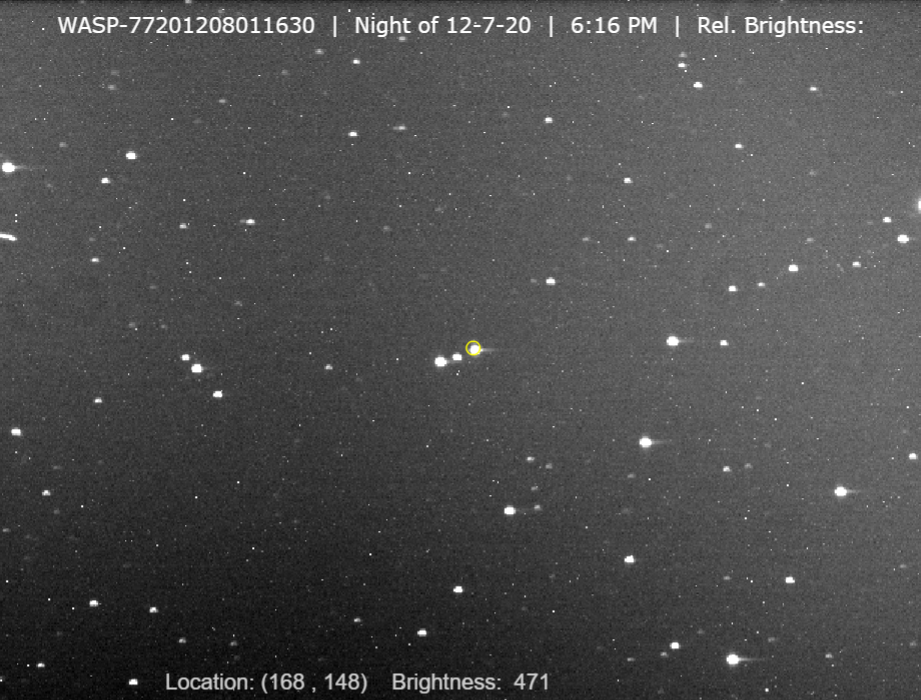
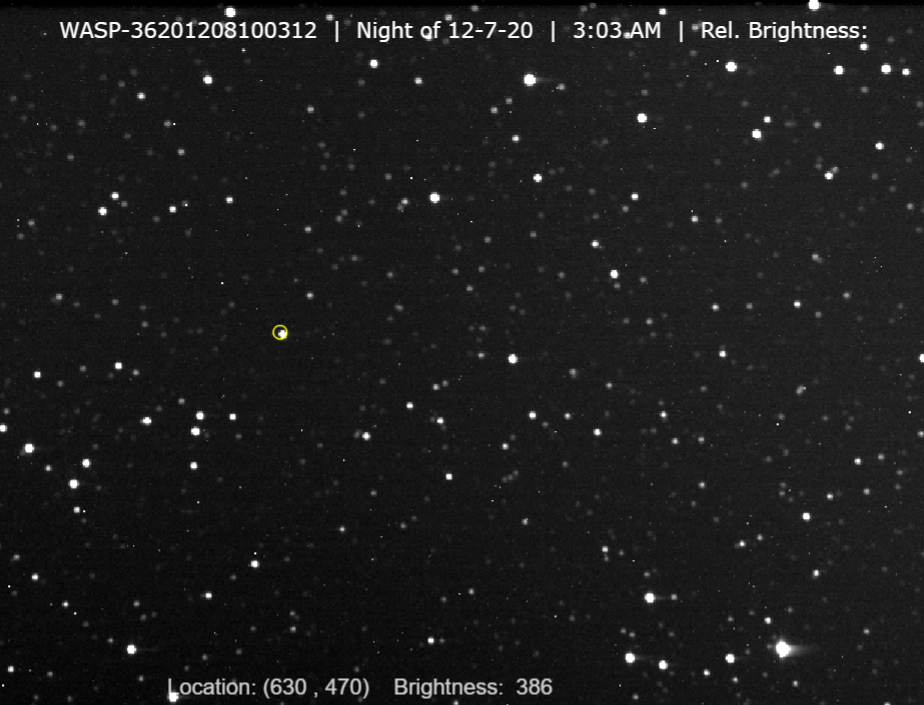
LABORATORY FOR THE STUDY OF EXOPLANETS:
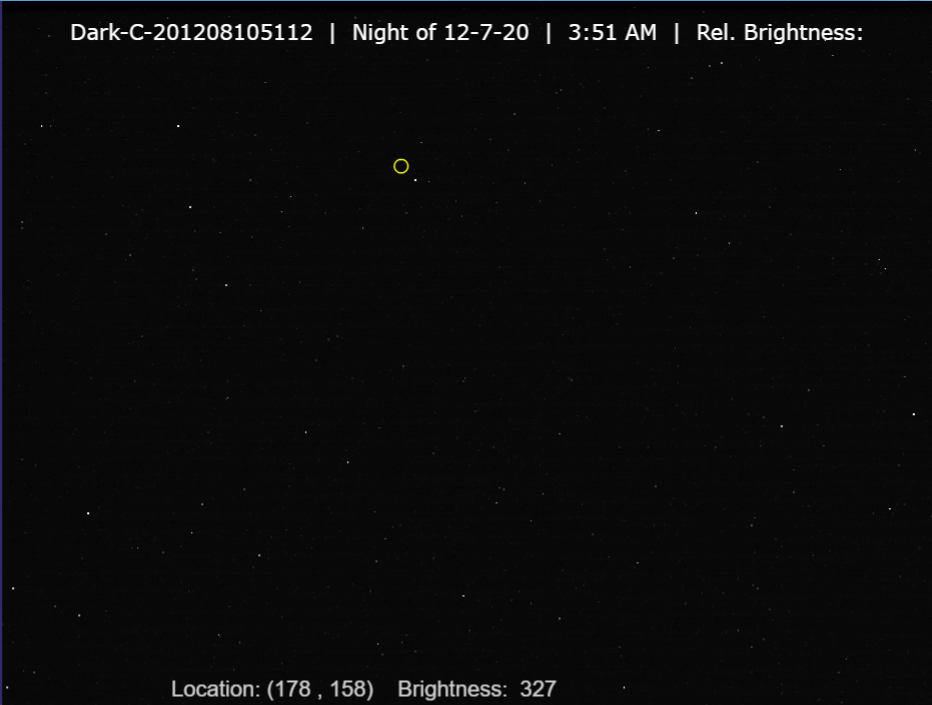
Using a telescope that you control online, you'll take images of distant solar systems, interpret the data you gather. With this website: https://www.cfa.harvard.edu/smgphp/otherworlds/ExoLab/ .
Then I show you some images that I have been able to make with this website.
-GOOGLE SCHOLAR: I have used google scholar to search for information that has been made by scientists and not to search for false information.